Those who can’t handle the truth,
try to silence those who speak it.
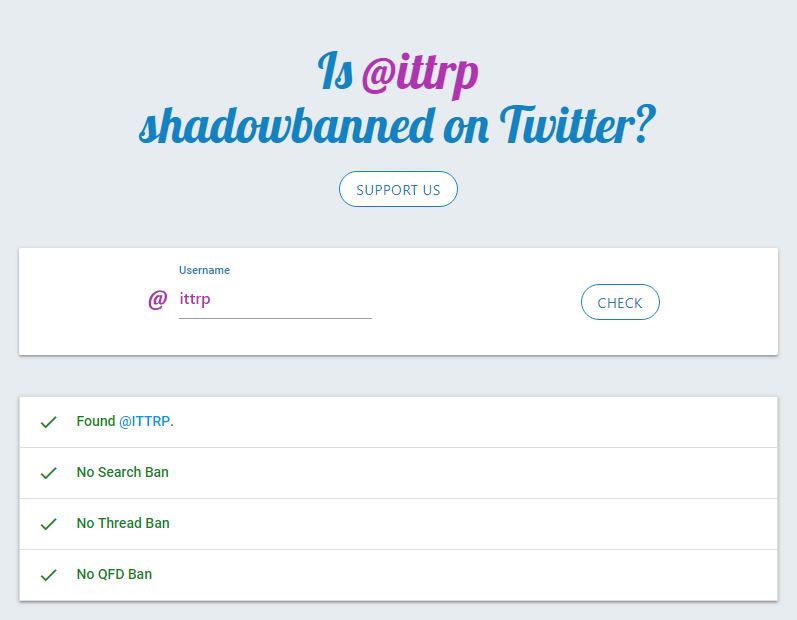
I have been Shadowbanned on Twitter:
shadowban.eu results for my twitter ID, captured yesterday:

Did I tweet anything untrue?
Did I tweet anything that was “unhealthy”?
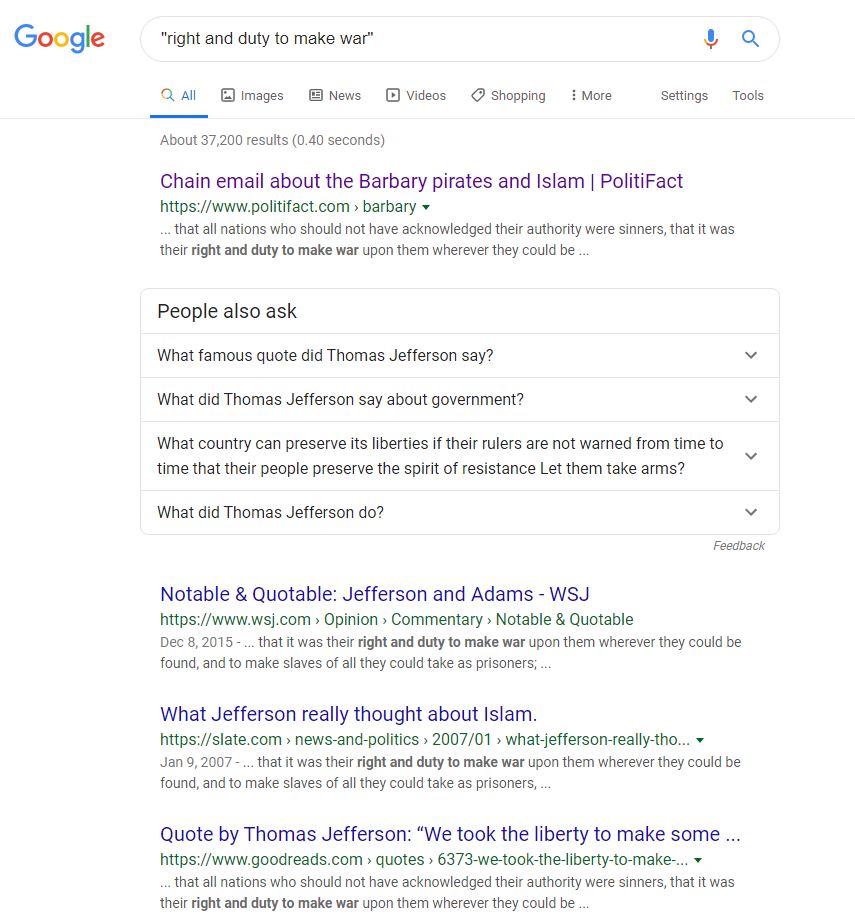
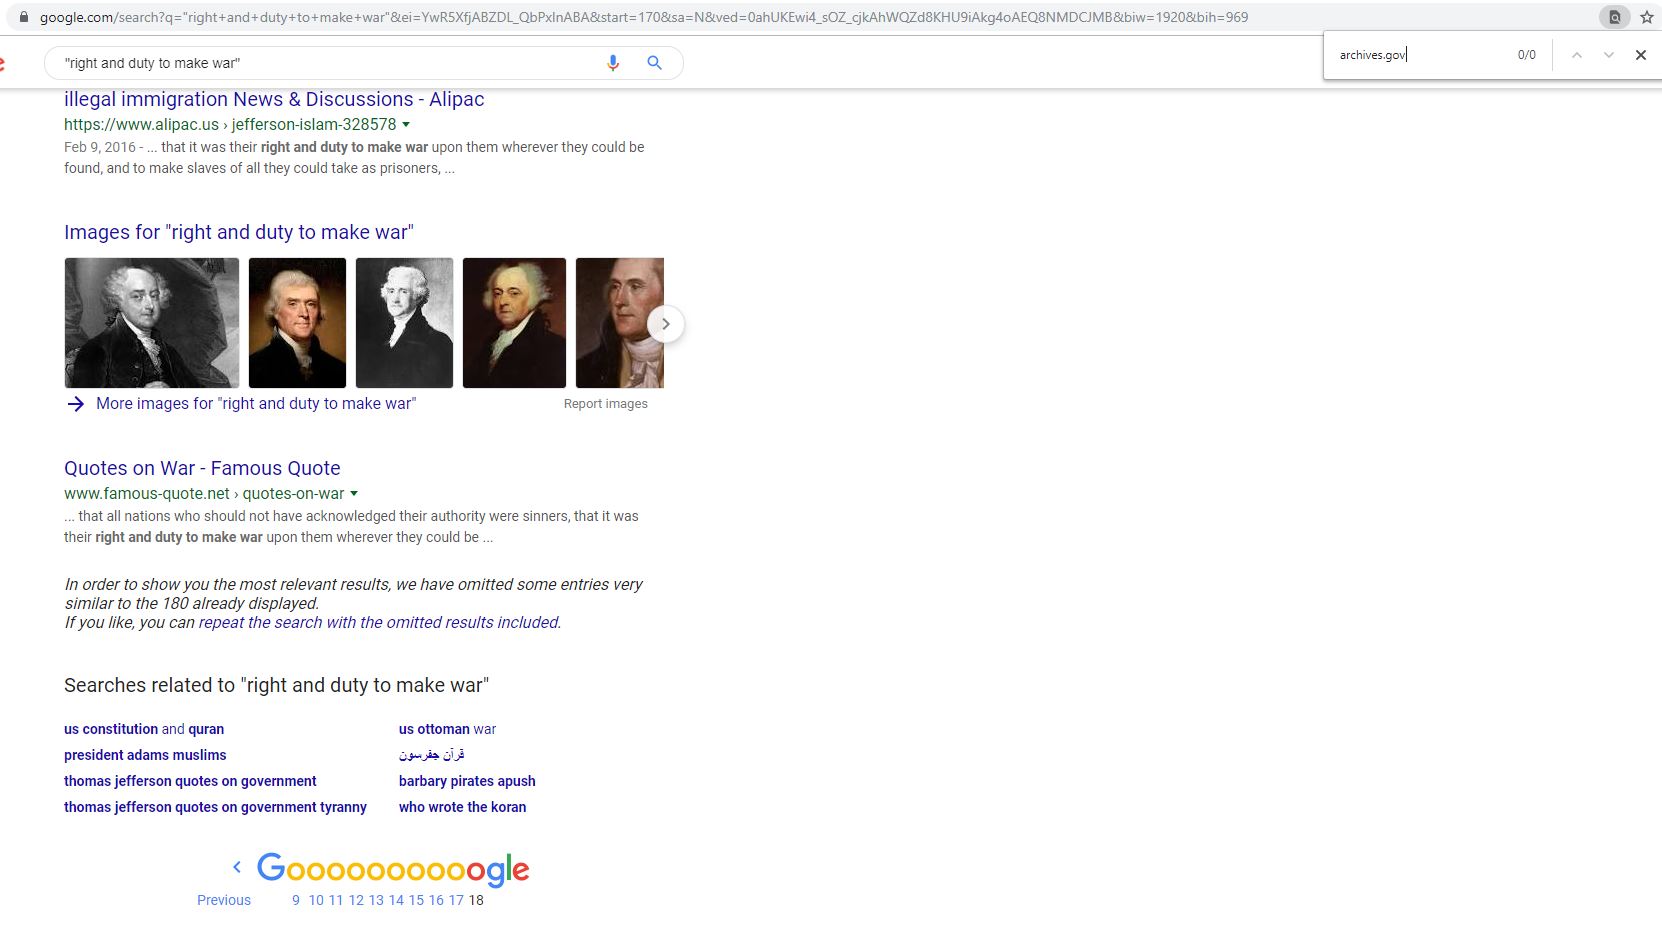
I tweeted the truth, with .gov data sources to prove what I said was true.
I tweeted respectfully, though boldly, challenging people to retweet the verifiable truth that I had shared with them.
The algorithms put in place by Twitter decided that my voice needed to be silenced.
So, what did I say that was deemed so dangerous that I needed to be silenced?
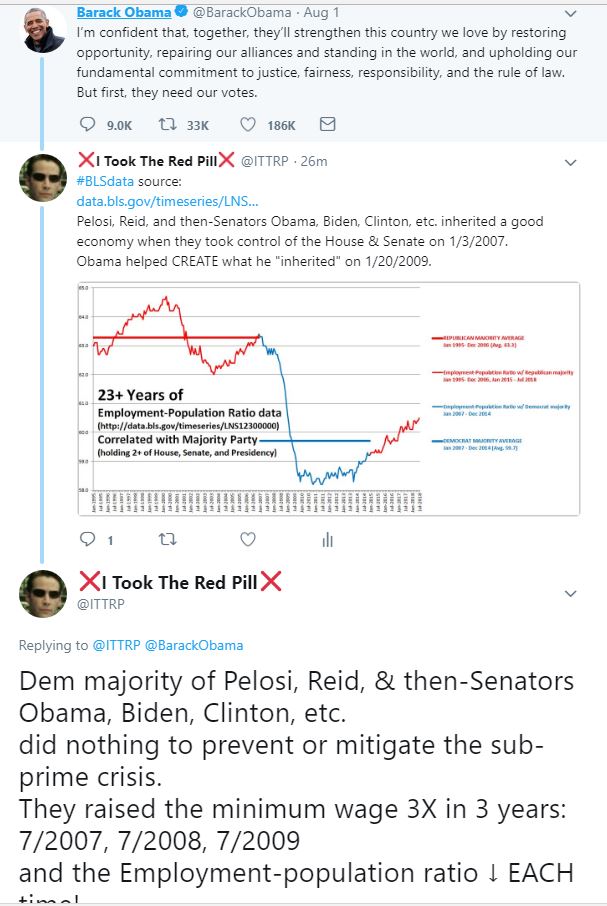
First, see this tweet from Joe Scarborough:
If you go to that tweet, and look at the replies, you won’t see anything from me.
Why?
Because I have been shadowbanned.
So, what did I say that was deemed so dangerous that I needed to be silenced?
https://twitter.com/ITTRP/status/1024145309629329408
Is speaking the truth “unhealthy”, Jack?
Is speaking the truth allowed only if you limit to whom you speak it?
If you speak the truth to too many people,
or to people who can’t handle the truth,
is that so “unhealthy” that Twitter has to silence your voice?
Those who can’t handle the truth,
try to silence those who speak it.
==================================================
UPDATE 8/7/2018:
==================================================
Twitter has changed their tactics slightly. Two days ago, the thread ban was lifted off of my account. Then, yesterday, it appeared that the search ban and QFD ban were lifted… at least from the perspective of what is checked by shadowban.eu/ittrp…
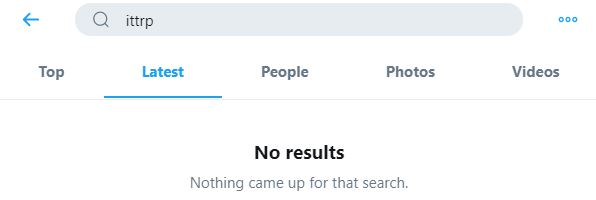
…but, certain tweets are still shadowbanned and made invisible to the intended audience. Go to https://twitter.com/BarackObama/status/1024691324933562369 and scroll down through all of the responses, until there are no more left to show. Then search the page for my id, “ittrp”. You won’t see my replies because they have been shadowbanned.
Now, go to https://twitter.com/ITTRP/status/1026607040934944769. You’ll only see that tweet if you already have the direct URL, but it’s worse than that… that tweet itself is a reply to another tweet of mine that is also being shadowbanned.
Here’s what you see if you’re not logged in as me:

But, like I said, that tweet is a reply to another tweet that has been Shadowbanned. Here’s what Twitter shows me for that same tweet URL when I am logged in:
That tweet in the middle is only shown when logged in as me. It is hidden from everyone else.
So there you go. Proof that Twitter is shadowbanning tweets from people who are speaking verifiable truth to power. My chart shows data directly from a .gov web site, https://data.bls.gov/timeseries/LNS12300000&from_year=1995, correlated with majority party (holding 2+ of House, Senate, & Presidency):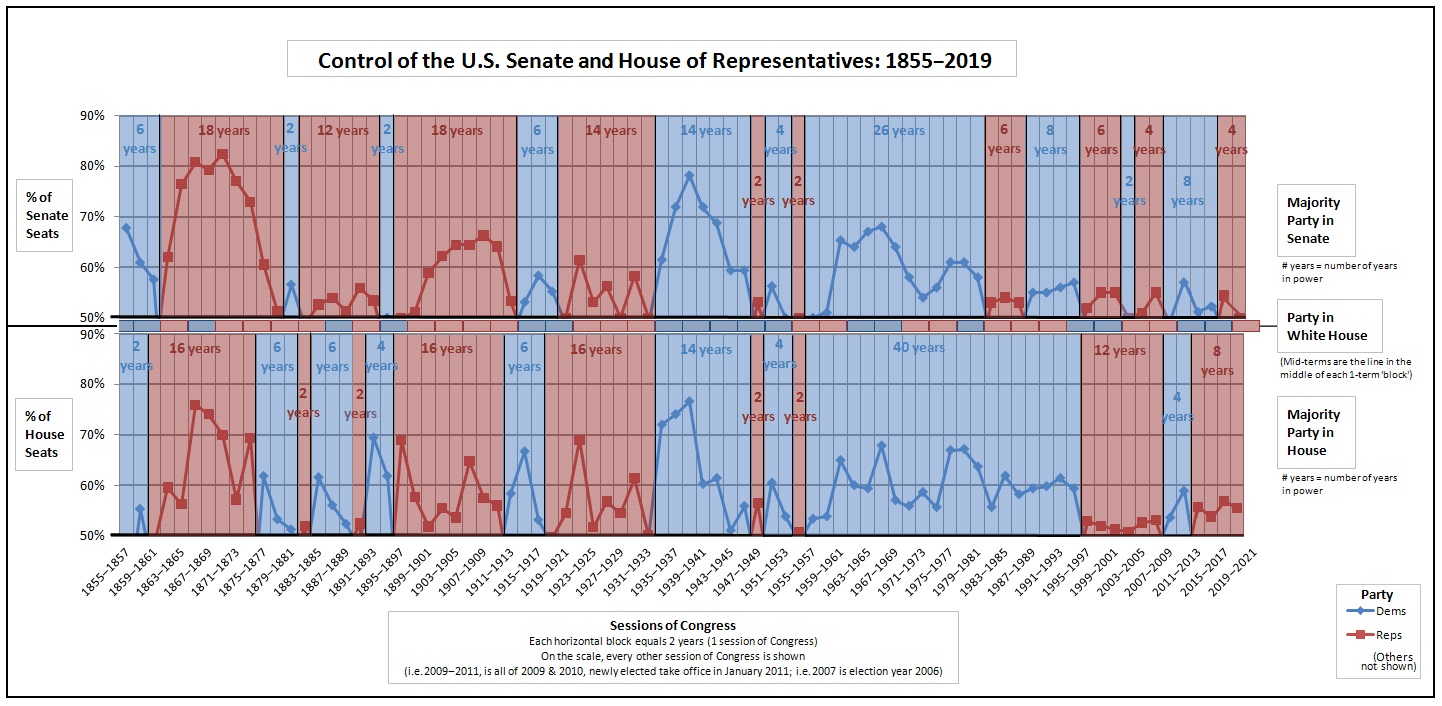
I did not say anything untrue. I did not say anything racist, hateful, “unhealthy”, etc.
I said things that are demonstrably true.
And Twitter’s algorithims are shadowbanning my content, still, even though they have figured out how to fool shadowban.eu/ittrp into showing all green check marks for my account.


